TradeMind Journal - Data Driven Trading Journal Prototype
High fidelity Figma Make prototype that adapts features to trader experience levels and turns raw trades into actionable insights.
Technologies & Tools
Frontend
Backend
Database
Design
Other
TradeMind Journal - where introspection meets numbers
Retail and prop traders struggle with two things: clean statistics and honest self reflection. TradeMind Journal tackles both in a single prototype. It blends a data dashboard with a trading diary so users can see what they did, why they did it and how it affected results.
The brief
Log trades fast. Surface only the signals that matter. Make the first insight obvious.
Research snapshot
- Personas: Newbie Nate, Analytical Alex, Arsenio Lupin III. Each persona has different goals and tolerance for complexity.
- Journey map: Awareness to Loyalty in six steps. Onboarding was the biggest drop-off risk, so Sprint 1 focused on that.
Core flows
1. Authentication
- Login with demo credentials autofill
- Sign up with name, email and password
- Password reset via email form
- Light and dark theme toggle even on auth screens
2. Onboarding wizard
- Experience Level: Beginner, Intermediate, Advanced. Each card lists the features unlocked.
- Trading Account: Name, type (Live or Sandbox), base currency.
- Account Group: Optional grouping for multiple accounts. Calls to action: Continue, Back, Skip setup (Demo), Finish.
3. Dashboard
Selected account card at the top with Change Account button. KPI tiles: Total Balance, Today P&L, Total Trades, Win Rate. Quick links to Trades, Analytics and Manage Accounts. Recent activity empty state encourages first action.
4. Accounts
Card grid with drag-to-group tip. Status chips show Live or Sandbox. View Trades link on every card. Add New Account tile at the top.
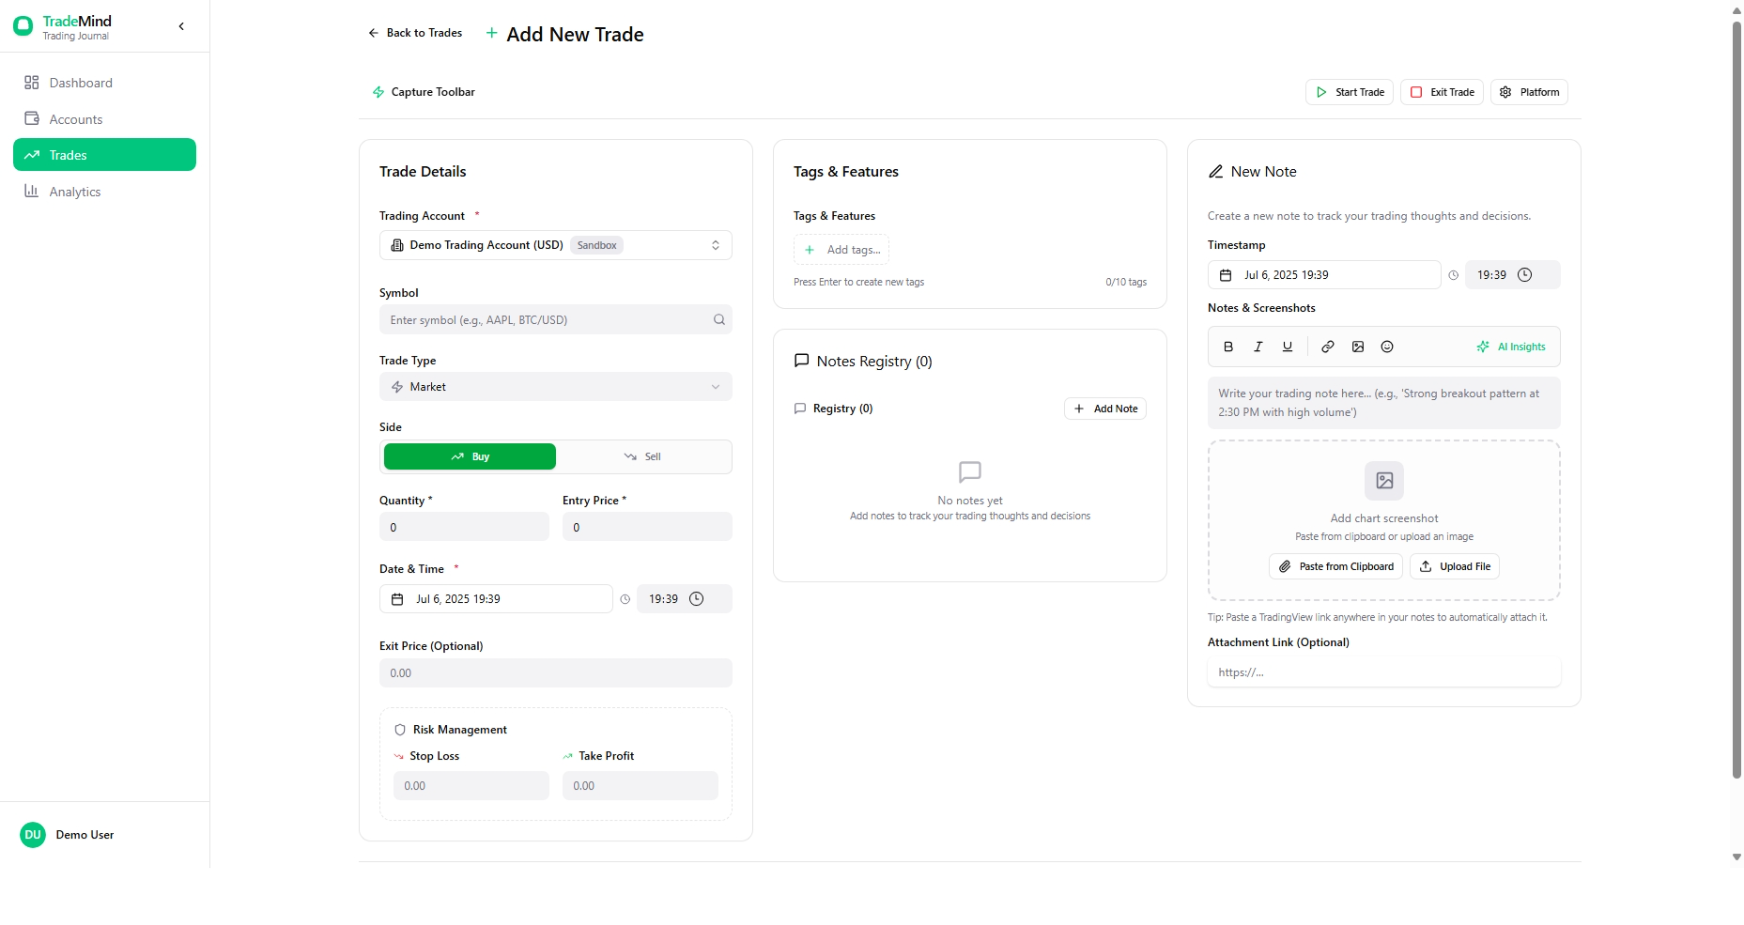
5. Trades
- Empty state: Import Demo Trades (mock dataset) or Add Your First Trade
- Add New Trade form: account selector, symbol search, trade type, side, quantity, entry price, date and time, optional exit price, stop loss and take profit fields
- Tags and Features: up to 10 tags
- Multi-note composer: timestamped entries, screenshot paste or upload (TradingView charts), optional attachment link
6. Analytics and reports
- Filters: account selector, date range, setup filter. Export CSV button (concept only, backed by mock data)
- KPI tiles: Total P&L, Win Rate, Avg Profit per Trade, Avg Loss per Trade, Max Drawdown, Profit Factor, Over Leverage Errors, Tilt Tag Count
- Charts: Tag distribution donut. P&L vs Emotion Trend with a Show Emotion toggle
- Tables: Top 10 Winning Trades with totals row and best/worst ratio
7. Profile and settings
Tabs: Account, Groups, Theme, Feedback, Logout. Feedback form with character minimum. Ability to change email and trading level.
Visual and interaction system
- Clean desk vibe: white space, muted greens, soft grays
- Iconography: simple line icons
- Dark theme mirrors light theme without neon gamer tropes
- Micro interactions: selected state badges, subtle success banners, loading spinner during demo import
What is special about the prototype
- Figma variables drive theme and state so one screen can show multiple conditions
- Many features (CSV export, API, advanced analytics) are conceptual and run on mock data generated via Claude 4 inside Figma Make
- Components are tokenized for straightforward dev handoff
- Flow covers full lifecycle: marketing site to auth to daily analytics
Project evolution and future plan
- 2024: Functional MVP in Flutter and Firebase
- Pause for budget review
- June 2025: Reboot as a Figma Make prototype to validate UX and platform direction quickly
- Next web build: Astro front end, Supabase auth/storage, Redux slices for client state, cookie consent first then OAuth (Google, GitHub, X). Only necessary cookies before consent.
- Expand features: multi-note support, adaptive layouts, AI timestamp detection for screenshots
Next steps
- Connect to a real backend for sync and persistence (Supabase planned)
- Implement auth middleware and cookie banner logic in Astro
- Package the analytics engine for reuse in other journals
What I learned
Let users self-select complexity early and keep copy and UI scoped to that choice. Demo data inside the prototype lets stakeholders feel value instantly without code. Switching platforms (Flutter to Figma to Astro) clarified what belongs to design versus code.
Challenges
- Serve beginners without dumbing down tools for experienced traders
- Show meaningful analytics without overwhelming users
- Keep note taking and screenshot attachment fast
Solutions
- Experience-level selector gates complexity and copy tone
- Top-level KPI tiles with filters, deeper charts below the fold
- Multi-note composer with clipboard paste and TradingView screenshots
Outcomes & Results
- Prototype covers the full flow from marketing site to analytics without a backend
- Mock demo data lets stakeholders experience value instantly
- Advanced features (CSV export, API, AI insights) are concept only and run on mock data
Design Process
Discovery
Three personas (Newbie Nate, Analytical Alex, Arsenio Lupin III) and a 6-step journey map from Awareness to Loyalty.
Problem framing
Pains: slow manual journaling and no emotional awareness. Success bar: trade entry under 30 seconds and first insight under 2 minutes.
Information architecture
Entities: Accounts, Trades, Tags, Notes. Optional Account Groups for multi-broker reality.
Interaction design
3-step onboarding wizard, rich trade entry, analytics dashboards, profile settings. Figma variables drive theme and feature gating.
Pause and reboot
First MVP in Flutter + Firebase (2024). Project paused, then restarted June 2025 in Figma Make to explore platform-agnostic direction.